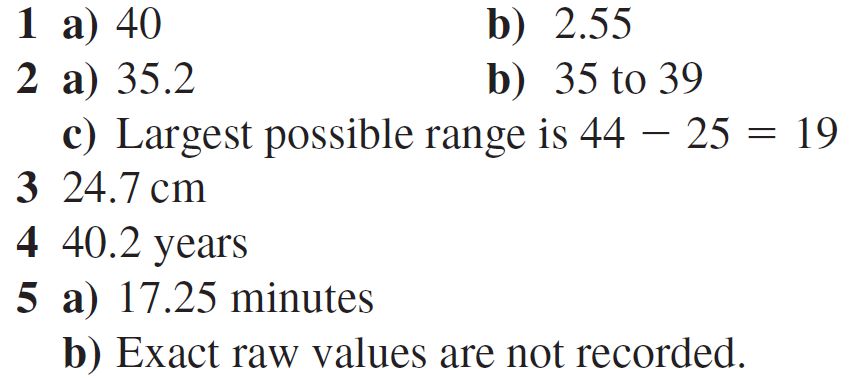
Boxes of matches are supposed to contain an average of 50 matches. Sophie decides to check this figure. She takes a sample of 20 boxes, and counts the matches in them.
a) Calculate the value of the mean. b) Write down the mode. c) Work out the range of the data. d) Find the value of the median. e) Find the interquartile range.
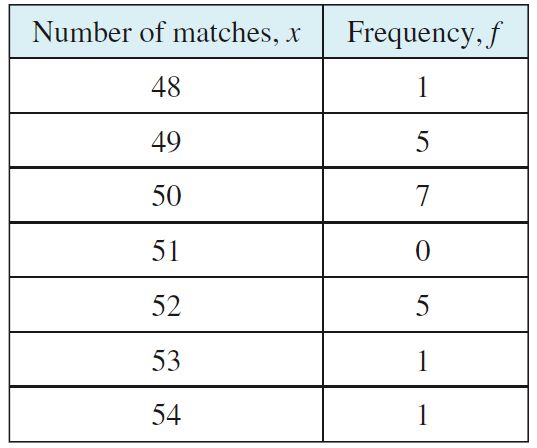
The marks for Year 10’s end of term mathematics test are shown in the table.
a) Calculate an estimate of the value of the mean. b) Write down the modal class. c) Work out an estimate for the range of the data. d) Suggest a value of the median. e) Estimate the lower and upper quartiles, and the interquartile range.
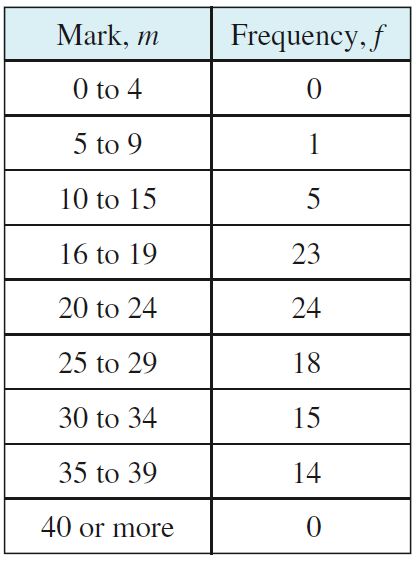
The resistances (in ohms) of a sample of 50 electronic components are measured. The table shows the results:
a) Calculate an estimate of the mean resistance. b) State the class interval that contains the median resistance. c) Explain whether it is possible for the range to be 48.
Tanya surveys cars driving past her school into town in the morning. She counts the number of occupants of each car. The frequency table shows her results.
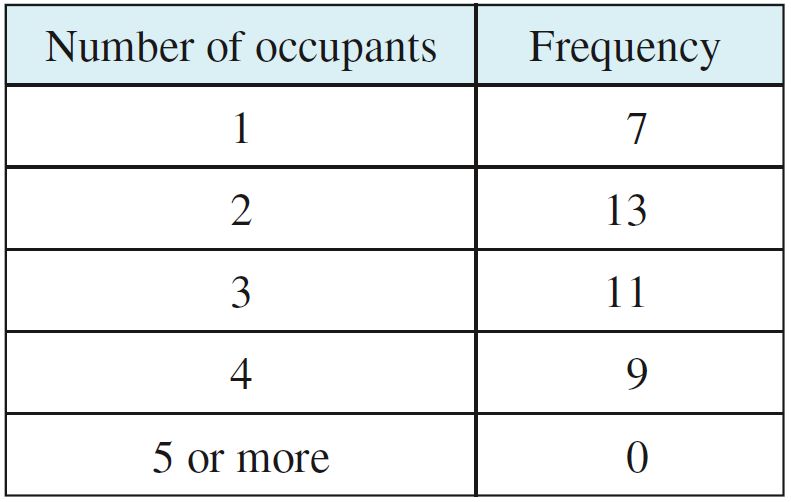
a) How many cars did Tanya survey? b) Work out the mean number of occupants per car.
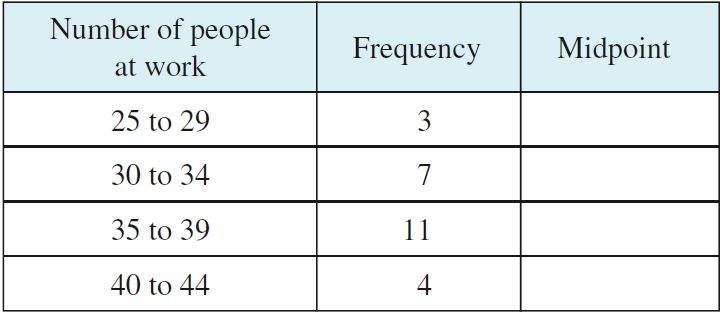
Maurizio records the number of people at work in his department each day. The frequency table shows his results.
a) Calculate an estimate of the mean number of people at work each day. b) State the modal class. c) Benoit says, ‘The range is 20.’ Explain why Benoit must be wrong.
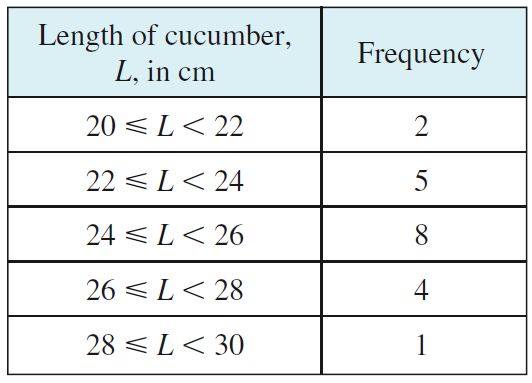
Meera has measured the lengths of a sample of cucumbers from her stall. The frequency table shows her results.
Without using a calculator, work out an estimate for the mean length of a cucumber in this sample. Show all your working clearly.
A registrar records the ages of men who were married in her office during one week. The frequency table shows her results.
Work out an estimate of the mean age of the men who married that week. Give your answer of years correct to 3 significant figures.
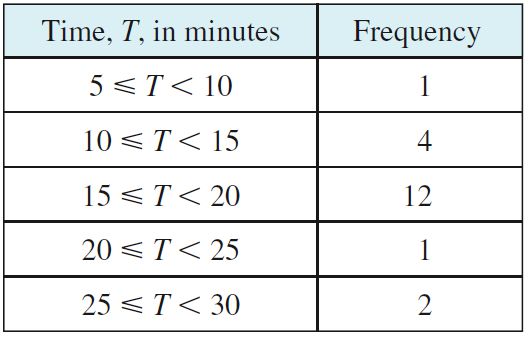
Sean sets his friends a puzzle, which they solve under timed conditions. The frequency table shows the times taken.
a) Calculate an estimate of the mean time taken to solve the puzzle. b) Explain briefly why your answer can only be an estimate.

Calculations with frequency tables
Case 1: Simple discrete
Case 2: Grouped discrete
Case 3: Grouped continuous